
You can't fix what you can't see. SMS marketing analytics is how you turn a send into a decision — which messages landed, which bounced, which started a conversation, and which pushed people to opt out. PitchPrfct's analytics dashboard puts all of it in one view and refreshes about every five minutes, so the numbers you act on are close to live. This is for anyone who sends text at volume — sales teams, real estate brokers, recruiters, churches, e-commerce shops — and wants the send to get smarter each time.
The metrics that matter
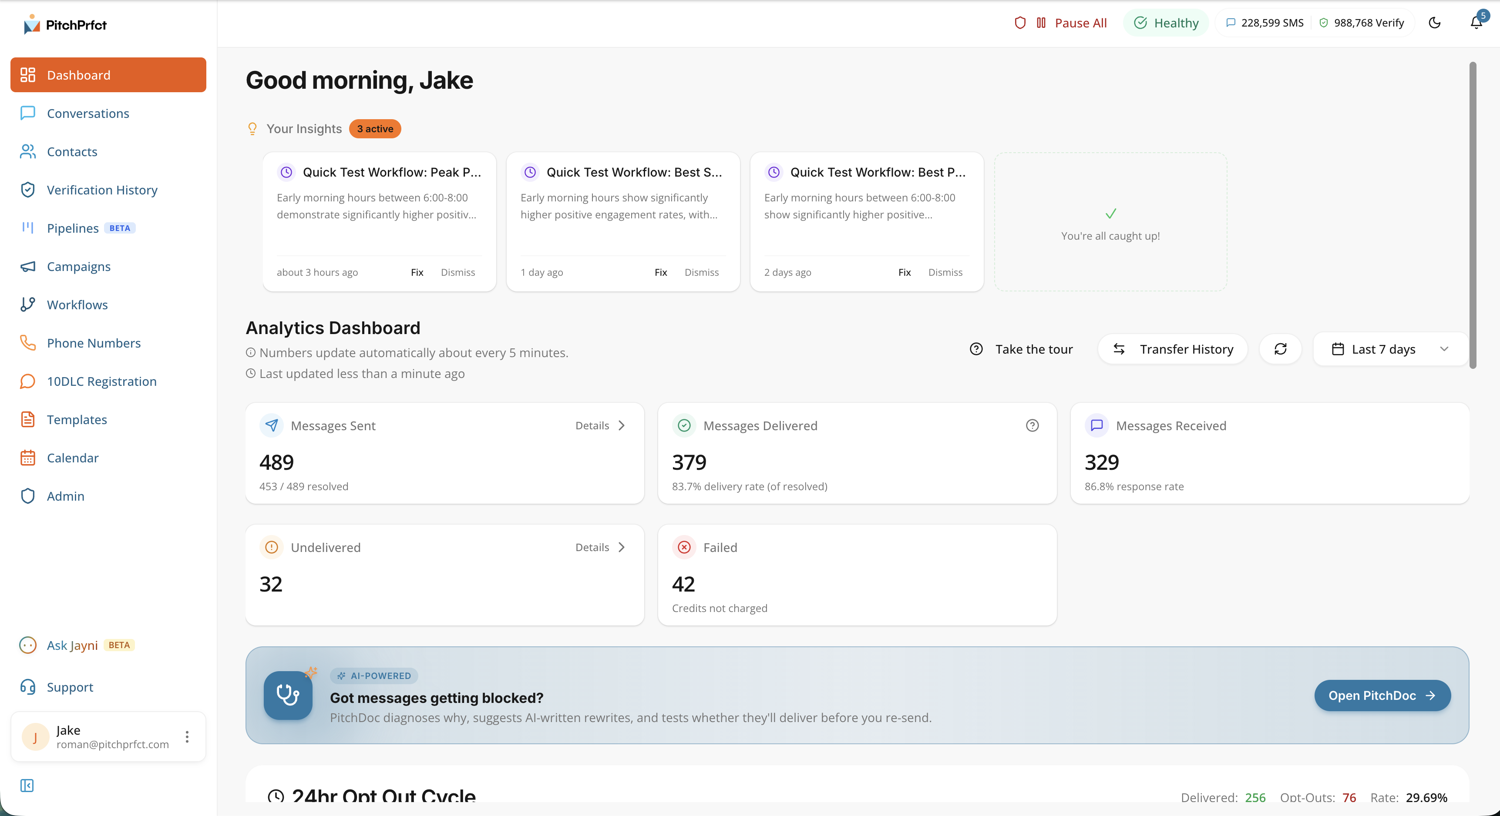
Good SMS marketing analytics comes down to a handful of states. Here's what each one tells you at a glance.
| Metric | What it counts | What it tells you |
|---|---|---|
| Sent | Messages you dispatched | Your volume — the baseline every other number reads against |
| Delivered | Messages the carrier confirmed reached a handset | Your reach; a widening gap from Sent is an early warning |
| Received | Replies coming back from contacts | Engagement — did the message start a conversation |
| Undelivered | Left PitchPrfct, carrier couldn't complete | Usually list quality: stale, disconnected, or blocked numbers |
| Failed | Never made it out at all | Usually setup: configuration, formatting, or 10DLC |
| Opt-out rate | STOP replies as a share of delivered | Frequency and targeting feedback |
| Response rate | Replies as a share of delivered | Whether the copy and offer actually worked |
For context on where healthy looks: per Twilio's SMS marketing benchmarks, a good opt-out rate sits below about 1% per send, and rates above 2% are a flag to review your content, frequency, or targeting. Treat industry figures as a direction to face, not a promise — your own dashboard is the number that counts.
What each card means in practice
Sent. The total you dispatched. This is your volume — the top of the funnel for any campaign or SMS marketing push. Every other number reads against it.
Delivered. Messages the carrier confirmed reached a handset. Watch this against Sent over the life of a send. A widening gap is your earliest warning that something — a stale list, a flagged number, a filtering issue — is getting in the way.
Received. Replies coming back from your contacts. Inbound is where texting earns its keep. Questions, "yes I'm interested," scheduling — they all show up here, and they prove the message started a conversation instead of just landing in a thread.
Undelivered. Messages that left PitchPrfct but the carrier couldn't complete: a disconnected number, a device that's off, a block. Undelivered is usually a list-quality story. A spike points you at stale or unverified contacts.
Failed. Messages that didn't make it out at all. This is a different problem from undelivered — it points back toward setup, formatting, or sending configuration, not the recipient. When failures climb, check the send itself.
Opt-out rate. The share of people who reply STOP. PitchPrfct handles STOP automatically, but the rate is feedback. A normal trickle is healthy; a sudden jump means a message hit wrong.
Response rate. Replies as a share of delivered. This is the closest thing text message analytics gives you to "did it work." High delivery with a low response rate means the message landed and did nothing — a copy problem, not a reach problem.
Reading the dashboard as a working tool
Numbers on a screen don't help unless they change what you do next. Here's how to read the SMS analytics dashboard, not just stare at it.
Compare states, don't just count them. A single number means little in isolation. The relationship between cards is where the signal lives. Sent versus Delivered tells you about reach. Delivered versus Received tells you about engagement. Watch the ratios move, not the totals.
Treat undelivered as a list problem. If undelivered runs high, the issue is usually who you're texting, not what you're saying. Clean stale numbers, drop contacts that bounce repeatedly, and confirm consent is current. A tighter list lifts every downstream metric.
Treat failed as a setup problem. Failures point inward. Check your sending configuration, your number, and your 10DLC registration before you blame the list. PitchPrfct's guided 10DLC flow exists to keep this number low.
Let a weak response rate rewrite your copy. Lots of delivered, few replies? That's a content signal. Change the opener, sharpen the offer, add a clear reply prompt — then send again and compare.
Watch opt-out rate as a frequency gauge. If opt-outs climb, you're likely sending too often or to the wrong people. Slow down or tighten targeting before the list erodes. If you're new to the rules behind opt-outs, our guide to TCPA compliance covers what the law actually requires.
Because the data refreshes about every five minutes, this isn't a post-mortem you read the next morning. You can watch a campaign unfold and step in while it still matters.
Let the AI read it for you
You don't have to interpret the numbers alone. Jayni AI, PitchPrfct's built-in copilot, can analyze performance and surface issues from a plain-language prompt. Ask why undelivered spiked on yesterday's send, or which list is dragging your response rate, and Jayni reads the same data and answers in words. It turns the dashboard from something you monitor into something you can question.
Where the dashboard lives
The analytics dashboard is part of PitchPrfct, the compliance-first, SMS-only platform:
- One flat price. $99/mo + $0.007 per segment, all-in with carrier fees included — per-message only, no credit buckets. Like any platform, $1/mo per number and the standard $10/mo TCR campaign fee apply on top, and unused credits roll over one month. See the full pricing breakdown.
- Compliance built in. Automatic opt-out (STOP) handling, quiet hours, and list scrubbing, plus guided 10DLC registration — and the dashboard lets you watch the opt-out cycle as it happens.
- AI on tap. Jayni can read your reporting metrics and tell you what changed.
- SMS-focused. It does texting, not email — and the reporting is built for that channel.
Frequently asked questions
What is SMS marketing analytics?
What metrics does PitchPrfct's analytics dashboard track?
How often does the dashboard update?
What's the difference between undelivered and failed?
How do I improve my SMS reporting metrics?
Can the dashboard tell me what to fix?
Want to see your own texting in numbers? Start a free trial.